AI-Powered Utilities Intelligence · Article 2
Your data has a story to tell.
A utilities KPI tells you that consumption is higher than expected. The next question is: where should the investigation begin?
A plant-wide increase can send several people searching through meters, production records and shift reports. A focused analysis can narrow that work to one line, one time window and a measurable amount of additional consumption.
That is the value of combining a model of expected consumption with clear, AI-assisted interpretation: giving an overloaded team a better starting point, sooner.
What should consumption have been?
Yesterday’s consumption is not always a fair comparison. Today may involve different production volumes, product formats or operating states. A line running normally, changing products or waiting in standby has different utility requirements.
A historical model learns those relationships and estimates expected consumption for the conditions being assessed. It also establishes a reference range, allowing for ordinary variation rather than flagging every small difference.
This is different from a target. A target expresses the performance the business wants. A model estimates what the recorded operating conditions would normally require. Both help distinguish a demanding target from an unusual loss.
The same approach applies to water, electricity and steam. Each needs its own model, appropriate measurements and relevant operating context.
One plant view. A clear priority.
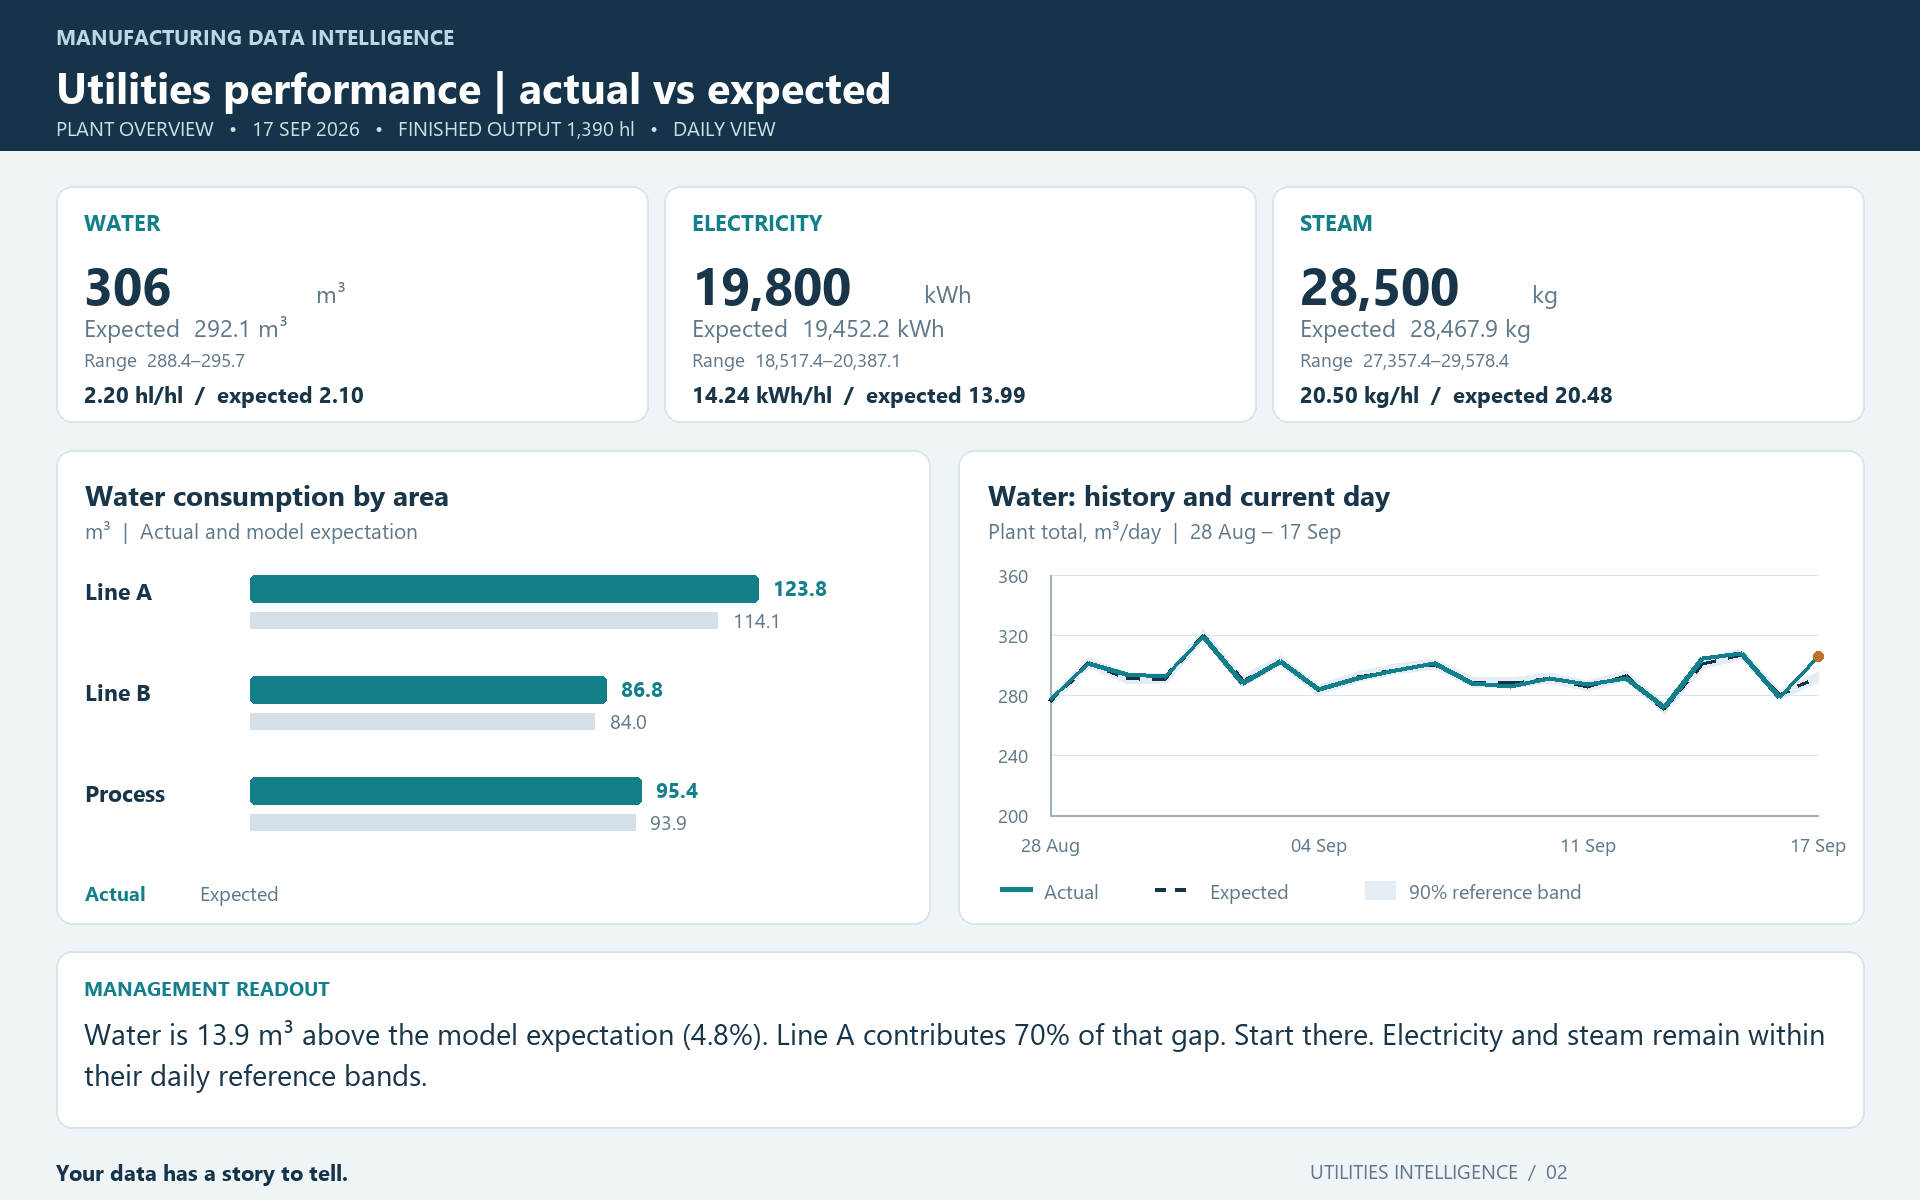
In this illustrative daily report, the plant produces 1,390 hl of finished product and uses 306 m³ of water. That is 3,060 hl of water, or 2.20 hl/hl of finished output.
The fitted model expects approximately 292.1 m³, equivalent to 2.10 hl/hl. Actual consumption is about 13.9 m³ higher, a 4.8% deviation, and exceeds the expected range.
From a plant variance to a focused investigation
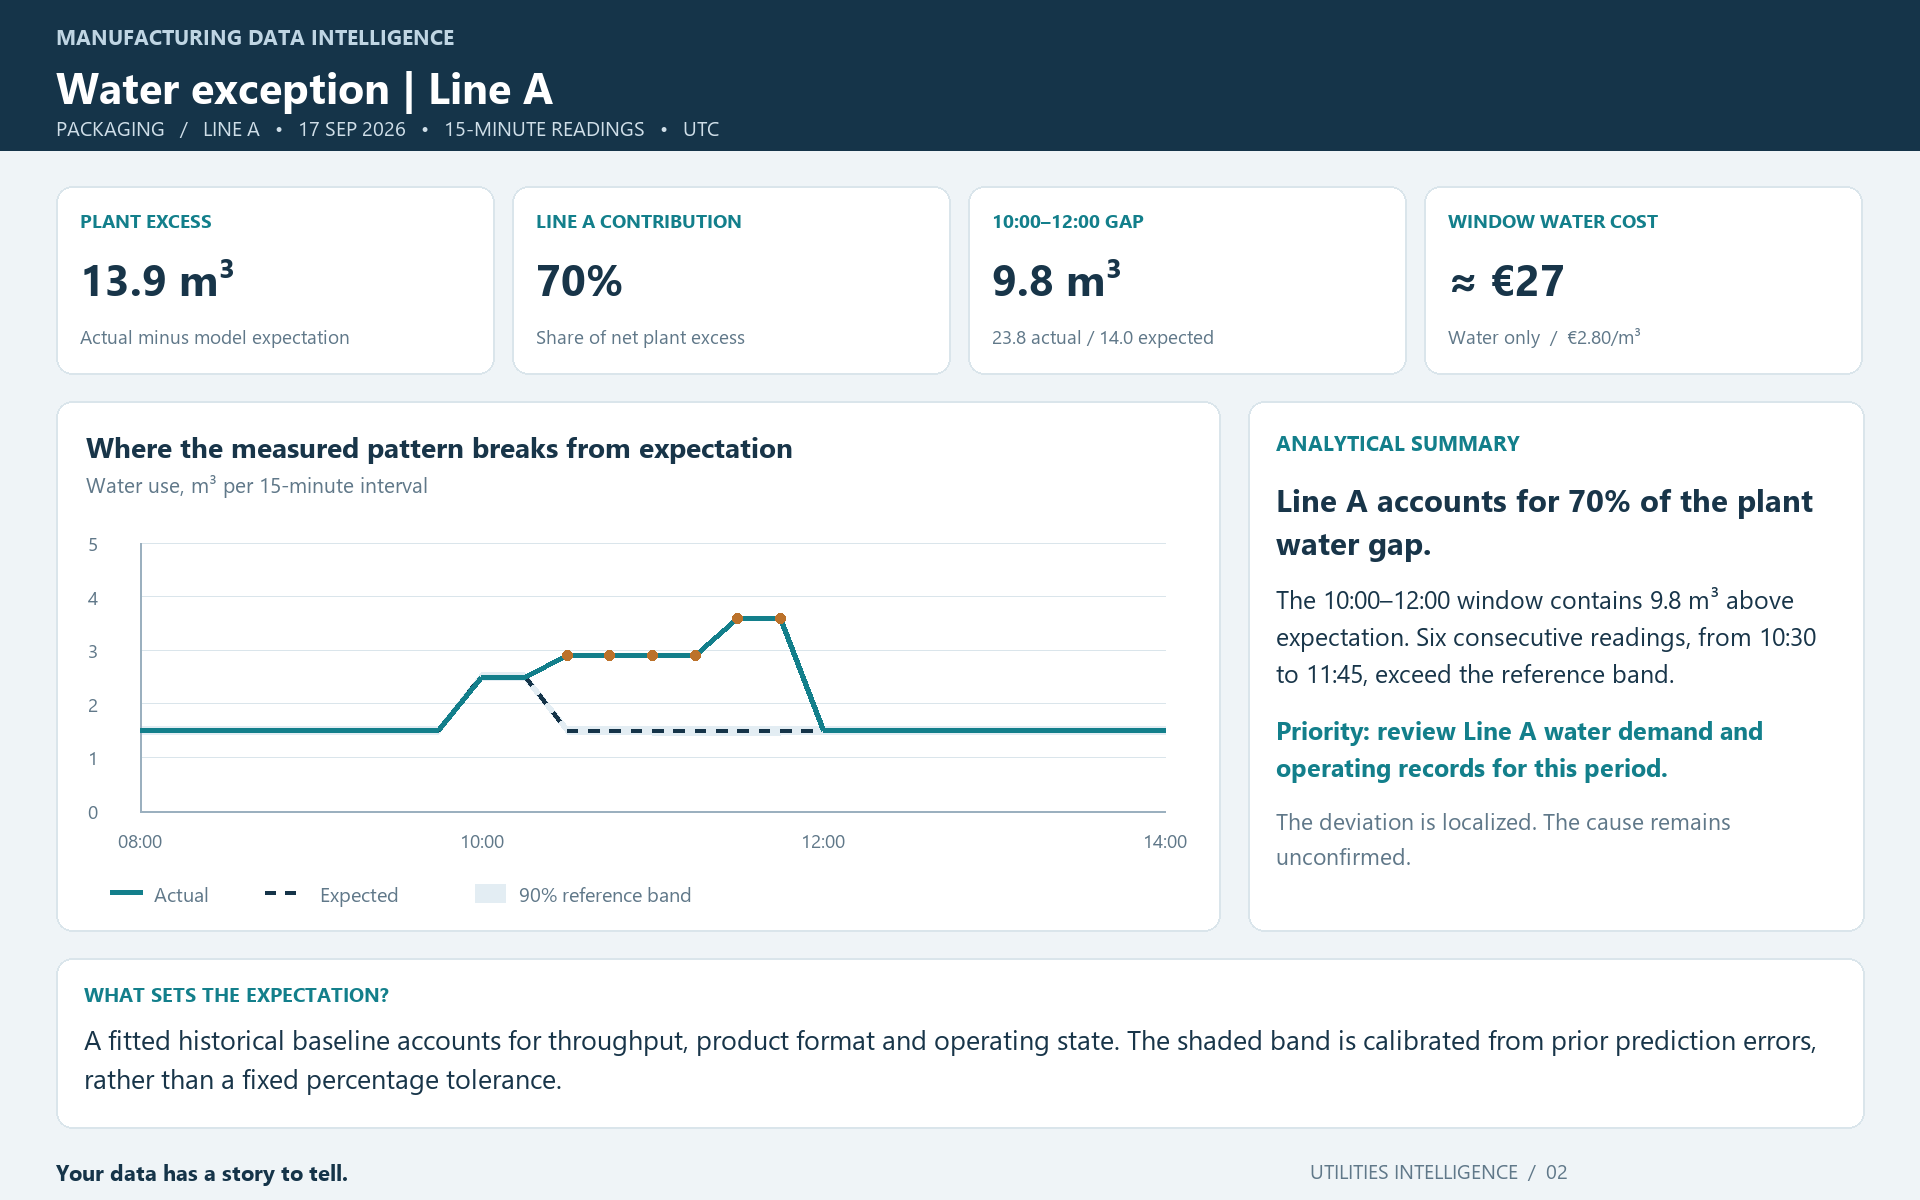
The plant-wide figure is only the starting point. The area breakdown identifies Packaging Line A as the main contributor, and the analysis narrows the investigation to a two-hour window.
The investigation can now focus on a specific line and period, without drawing several people into a plant-wide search.
From analysis to action
Alongside the report, an AI assistant can bring the findings together in plain language:
“Packaging Line A accounts for approximately 70% of the plant’s additional water consumption. Between 10:00 and 12:00, it used approximately 9.8 m³ more than expected. Prioritize a check of water demand and operating records for this period. The underlying cause still needs verification.”
The findings provide a clear basis for assigning a focused investigation, agreeing ownership and checking whether the deviation continues. That decision can happen during a shift handover, a performance meeting or while the shift is still running.
With suitable connected data and a validated model, this initial analysis can be available in minutes. The team’s expertise goes into verifying the issue and choosing the right action, with less time spent assembling the evidence.
The next article takes this one step further: connecting utility deviations with production events to understand what may explain them.



Recent Comments